Home > Research
Research
Molecules in the extracellular environment bind specifically to cell-surface receptors and trigger intracellular signaling, eventually leading to changes in cellular physiology. The translation of extracellular, chemical information into the correct cellular response is a process known as signal transduction. This process is mediated by of a diverse set of signaling molecules, i.e. enzymes, second messengers, scaffolds and transcription factors. It is increasingly recognized that spatial and temporal aspects of molecular interactions and activity are key for correct cellular responses. Our research aims at understanding the spatial and temporal regulation of signaling molecules that underly cellular processes. As a model we focus on signaling mediated by a class of seven-transmembrane spanning receptors, the G-protein coupled receptor (GPCR) family. We employ genetically encoded fluorescent biosensors that enable quantitative, functional imaging of molecular interactions, protein activities or second messenger concentration in single living cells. Below, you will find more information on GPCR signaling, fluorescent proteins and biosensors.
GPCR signaling
The "G-protein coupled receptors" (GPCRs) comprise the largest family of receptors. Almost 750 genes encoding a GPCR are identified in the human genome. These proteins can perceive a wide variety of signals including light, hormones, ions and neurotransmitters. Notably, over 30% of the pharmaceuticals on the market are targeted at GPCRs. GPCRs are coupled to G-proteins which are heterotrimers consisting of one alpha, one beta and one gamma subunit. The heterotrimer is a peripheral membrane protein due to lipid modification of the Galpha and Ggamma subunit. After activation of the receptor, the pre-coupled G-protein complex undergoes a conformational change, allowing the Galpha subunit to exchange GDP for GTP. Both the Galpha-GTP and Gbetagamma dimer are capable of activating downstream effectors. These effectors include adenylate cyclase, phospholipase C-beta, PI 3-kinase and RhoGEF.
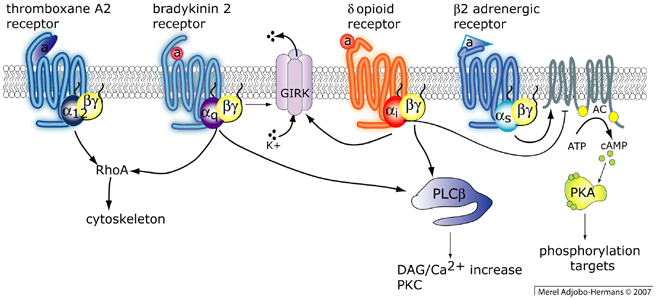
G-protein coupled receptors couple to different heterotrimeric G-protein complexes. Activated heterotrimers have a wide array of effectors including adenylate cyclase (AC), phospholipase C-beta, PI 3-kinases, GIRK channels and RhoA
Almost twenty different Galpha subunits can be discerned and these are grouped in four classes; Galphai/o, Galphas, Galphaq and Galpha12/13. Our primary focus is on signaling cascades via Galphaq, which is explained in more detail below. The Galphaq class has four members Galphaq, Galpha11, Galpha14, Galpha16 (=Galpha15 in mouse). The predominant effector of the Galphaq class is Phospholipase C-beta (PLC-beta). Interestingly, PLC-beta can also be activated by the Gbetagamma dimer. PLC-beta is a 150 kDa enzyme that catalyzes the hydrolysis of phosphoinositide PtdIns(4,5)P2 located in the plasma membrane into diacylglcyerol (DAG) and Ins(1,4,5)P3. DAG is a lipid that remains in the membrane, whereas the soluble headgroup Ins(1,4,5)P3 diffuses into the cytosol and releases calcium from intracellular stores. Both DAG and calcium are essential second messengers which activate downstream signaling components such as protein kinase C and calmodulin dependent kinase. The combined activity of second messengers and enzymes (lipases, kinases, phosphatases and GEFs) yields a physiological response.
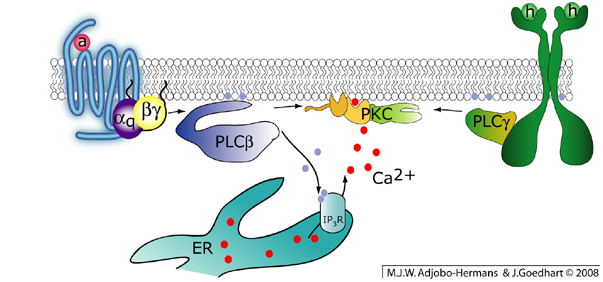
Galphaq activates phospholipase C-beta. This enzyme hydrolyzes the phospholipid PtdIns(4,5)P2 into DAG and InsP3, releasing calcium from the endoplasmic reticulum (ER). The combined presence of DAG and calcium is required for the activation of classical PKCs. Note that PKC can also be activated by receptor tyrosine kinases that activate PLC-gamma.
Fluorescent Proteins
The gene encoding green fluorescent protein (GFP) was isolated from the jellyfish Aequorea victoria, initiating a revolution in cell biology. It has been demonstrated that the GFP does not require a co-factor to become fluorescent and that it can be expressed in any type of organism. Nowadays, GFP is probably the most popular fluorescent probe to study proteins in living cells and has almost completely replaced the fluorescent labeling of proteins by organic fluorophores. The advantage of a probe that is genetically encoded usually outweighs the disadvantage of its size (MW=28000 versus MW<1000 for an organic probe). In 2008, the Nobel Prize in Chemistry was awarded jointly to Osamu Shimomura, Martin Chalfie and Roger Y. Tsien "for the discovery and development of the green fluorescent protein, GFP".
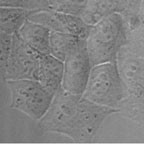
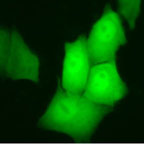
Mammalian cells transfected with a plasmid containing cDNA of Green Fluorescent Protein (GFP) driven by a CMV promotor. Cells are visualized by phase contrast (left) and fluorescence microscopy (right). Several cells express the GFP, fluorescing in green, when excited with blue light.
In the meanwhile numerous mutants of GFP have been described that have altered spectroscopic properties. For example, cyan fluorescent protein (CFP) and yellow fluorescent protein (YFP) are both derived from GFP and can be detected independently without cross-talk. A new generation of fluorescent proteins is derived from corals. These creatures display a wide variety of colors and cDNAs encoding a complete palette of fluorescent proteins are available.
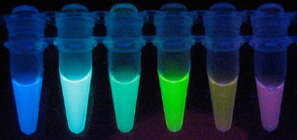
Photograph taken from purified fluorescent proteins excited by UV. From left to right; blue fluorescent protein (BFP), cyan fluorescent protein (CFP), green fluorescent protein (GFP), yellow fluorescent protein (YFP), monomeric Kushibara Orange (mKO) and mCherry. mKO from Kawasara et al. (2004), mCherry from Shaner et al. (2004).
In our research we mainly use the fluorescent protein as a probe to examine the localization of (part of) a protein in living cells. Besides localization, we can obtain information on dynamics (by time-lapse imaging), diffusion (by FRAP), and interactions (by FRET). The advantage of fluorescent proteins that emit different colors of light, is that they can be separated based on their emission spectrum. Hence, multiple fusion proteins can be visualized at the same time independently of one another. This is used in co-localization studies, which are usually performed on a confocal fluorescence microscope (with a resolution of approximately 0.2 µm). To detect protein-protein interactions (or conformational changes) between fluorescently tagged proteins, FRET can be used, since it provides a higher spatial resolution. The most popular FRET pair is CFP-YFP. Based on structure-guided evolution we have developed a very bright CFP variant, mTurquoise2, which is an optimized donor for FRET to YFP (Goedhart et al., 2012). mTurquoise2 has a quantum yield of 93% which is among the highest of all characterized monomeric fluorescent proteins. The mTurquoise2 variant was developed in collaboration with Antoine Royant (ESRF, Grenoble, France).
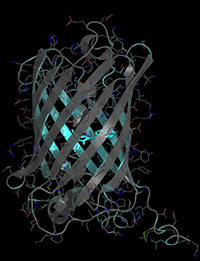
The crystal structure of mTurquoise2 (Coordinates available from the protein data bank, Structure ID=3ztf)
By using the right combination of proteins (and microscope settings) multiple fluorescent proteins can be visualized simultaneously in a single living cell. This is very exciting as it allows to do more experiments at the same time, in the same cell.
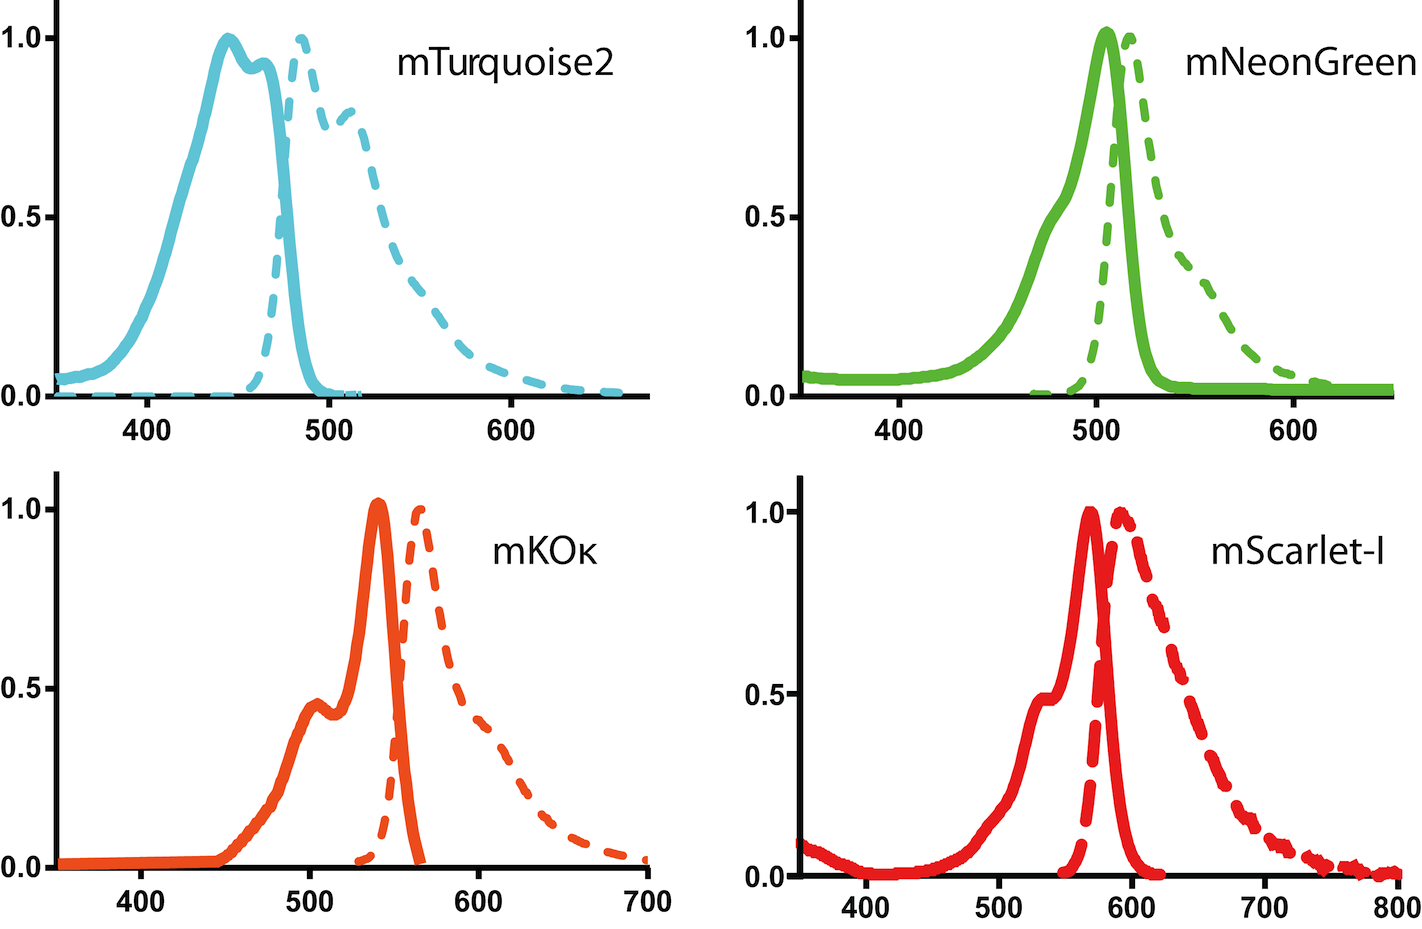
Fluorescence absorbance and emission spectra of several bright fluorescent proteins. Raw data available here
Biosensors
Genetically encoded biosensors are a class of GFP-based probes that report on protein activities, posttranslational modifications, conformational changes or other molecular processes. The biosensors are designed such that a change in activity is translated in a change in fluorescence intensity (intensity based biosensor), color (FRET based biosensor) or location (translocation sensor).
Tranlocation based sensor
This type of sensors changes location within the cell upon changes in activity. One class comprises translocation/relocalization based sensors that visualize lipids. By fusing a fluorescent protein to a lipid binding domain, the lipid which is recognized by the binding domain can be visualized. When an enzyme is activated that consumes this lipid, the location of the reporter is lost (see example below). Note that many proteins have the intrinsic ability to change location (PKC, beta-arrestins, transcription factors) and their location can be used as a read-out of their activity.
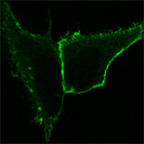
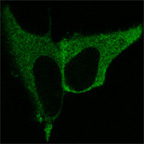
HeLa cells expressing a lipid binding domain fused to YFP. The lipid binding domain binds PtdIns(4,5)P2. Before stimulation (left) the domain is located at the plasma-membrane. After stimulation (right), PtdIns(4,5)P2 is hydrolyzed by PLC-beta and the YFP-tagged domain is released from the plasma membrane into the cytosol.
FRET based biosensor
An elegant approach to analyze molecular interactions is to measure fluorescence resonance energy transfer (FRET). To this end, the two molecules that are putatively interacting are labeled by two different fluorophores or fluorescent proteins. Cyan fluorescent protein (CFP) and yellow fluorescent protein (YFP) comprise a popular pair to measure protein-protein interactions. FRET occurs only when a donor (e.g. CFP tagged) and an acceptor (e.g. YFP tagged) molecule are in close proximity (less than 10 nm) and is therefore a measure of molecular interaction. FRET can be measured in combination with fluoresence microscopy, allowing the study of interactions in time and space. Several methods to measure FRET by fluorescence microscopy can be used, including fluorescence lifetime imaging, spectral imaging, donor fluorescence dequenching upon acceptor photobleaching. FRET can also be used to measure conformational changes of a molecule by measuring intramolecular FRET. This has been used to create reporters for second messengers by using protein (domains) that undergo a conformational change upon binding of e.g. Ins(1,4,5,)P3, calcium or cAMP.